
In the video titled “Troubleshooting SEO Issues with Browser Devtools” by Google Search Central, you will get an in-depth look at how to use browser devtools to debug technical SEO problems. The video explores the various tools available in Google Chrome DevTools, including inspecting the network, DOM, and requests/responses. It also provides information on the performance tools that can help you optimize your website.
So, if you’re facing any SEO issues and want to learn how to troubleshoot them using browser devtools effectively, this video is a must-watch. The video is part of the Lightning Talks series from Google Search Central, focusing on SEO, and it offers valuable insights and practical tips on using browser devtools for debugging purposes.
Whether you need to analyze missing content, examine network requests and responses, or understand how to optimize your website’s performance, this video provides a step-by-step guide to help you navigate through these technical challenges. So, if you want to enhance your SEO troubleshooting skills, this video will be a valuable resource.
Understanding Browser Devtools
Introduction to Browser Devtools
Browser Devtools are powerful tools that allow you to debug and troubleshoot various website technical issues. Whether you’re a developer or someone responsible for maintaining a website, understanding Devtools can be incredibly beneficial. In this article, we’ll explore the different features and functionalities of Devtools and how they can help you in SEO troubleshooting.
Importance of Devtools in debugging SEO issues
Search engine optimization (SEO) plays a critical role in the success of a website. When your website is not performing well in search engine rankings, it’s essential to identify and address any technical issues affecting its visibility. This is where Devtools comes in handy. They provide a comprehensive set of tools that enable you to analyze various aspects of your website, such as network requests, server response time, DOM structure, JavaScript interaction, and more. Using Devtools effectively, you can identify and resolve SEO issues quickly and efficiently.
Inspecting the Network
Understanding the Network tab
The Network tab in Devtools allows you to monitor and analyze all the network requests made by your website. It provides detailed information about each request, including the request and response headers, status codes, and timing information. By inspecting the Network tab, you can gain insights into how your website interacts with servers and identify any issues affecting its performance.
Identifying server requests and responses
In the Network tab, you can see all the requests made by your website, including requests for HTML files, CSS stylesheets, JavaScript files, images, and more. Each request is accompanied by a response from the server, which includes the content and metadata related to that request. By inspecting these requests and responses, you can identify any errors, slow-loading resources, or missing content that might impact your website’s SEO.
Interpreting waterfall view
The Network tab also provides a waterfall view, which visualizes the timing breakdown of each network request. This view helps you understand the events that occur while loading your website. You can see when a request is initiated, the time it takes to connect to the server, the time it takes to receive a response, and the overall time it takes to load the resource. By interpreting the waterfall view, you can pinpoint bottlenecks or delays and take appropriate measures to optimize your website’s performance.
Analyzing timing breakdown
In addition to the waterfall view, the Network tab provides detailed timing information for each network request. This includes DNS lookup time, connection time, SSL handshake time, waiting time, and content download time. By analyzing these timing breakdowns, you can identify any issues causing slow page load times or delays in server response. This information is crucial for optimizing your website’s performance and improving its SEO.
Investigating Server Response Time
Factors affecting server response time
Server response time is a critical factor that influences the performance of your website. Slow server response time can negatively impact user experience and SEO rankings. Several factors can affect server response time, including the server’s hardware and software configuration, the efficiency of the website’s code, the network latency between the server and the client, and the server’s workload. By investigating server response time using Devtools, you can identify any issues causing delays and take appropriate measures to improve them.
Indicator of slow server response time
A high server response time can be an indicator of slow performance. When analyzing the Network tab in Devtools, if you notice that the “Time to First Byte” (TTFB) is consistently high for most requests, the server takes a long time to send the response. Various factors, such as slow database queries, inefficient server-side code, or high server load, can cause this delay. You can improve your website’s performance and SEO by identifying and addressing the root cause of slow server response time.
Impact on SEO
Server response time is an essential factor that search engines consider when ranking websites. Slow server response time can lead to a poor user experience, increased bounce rates, and lower search engine rankings. By optimizing your server’s response time, you can enhance your website’s performance, improve user satisfaction, and enhance its SEO visibility.
Manipulating Network Conditions
Disabling cache
The cache is a mechanism that stores copies of resources (such as images, CSS files, and JavaScript files) locally on a user’s device. This allows subsequent page loads to be faster, as the browser can fetch those resources from the cache instead of requesting them from the server again. However, when troubleshooting SEO issues, temporarily turning off the cache can be helpful to ensure you see the most up-to-date version of your website. In the Devtools settings, you can quickly turn off the cache and force the browser always to fetch resources from the server.
Adjusting network throttling
Network throttling is a feature in Devtools that allows you to simulate different network conditions, such as slow internet speeds or high latency. By adjusting the network throttling settings, you can see how your website performs under various network conditions and identify any performance issues that might arise. This can be particularly helpful when troubleshooting SEO issues related to slow page load times or suboptimal user experiences on slower internet connections.
Changing user agent
The user agent is a string of text the browser sends to the server to identify the browser’s type and version. Different browsers and devices have different user agents, and websites can serve different content based on the user agent. Changing the user agent in Devtools allows you to simulate other browsers or devices to see how your website responds. This can be helpful when troubleshooting SEO issues related to browser-specific rendering or functionality.
Limitations and caveats
It’s important to note that manipulating network conditions in Devtools is a simulation and might not always perfectly reflect real-world scenarios. Your website’s actual user experience and performance can vary based on factors outside of your control, such as the user’s internet connection, device capabilities, and server infrastructure. While Devtools provides valuable insights and tools for troubleshooting SEO issues, it’s essential to consider the limitations and caveats of simulating network conditions.

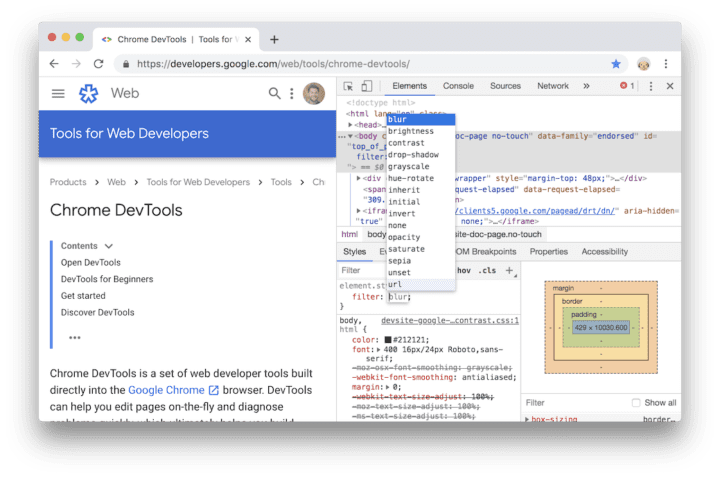
Inspecting the Document Object Model (DOM)
Introduction to DOM
The Document Object Model (DOM) is a programming interface for HTML and XML documents. It represents the structure of a web page and allows scripts to access and manipulate its content. Understanding the DOM is crucial for troubleshooting SEO issues related to missing or incorrect content on your website. Devtools provides a comprehensive view of the DOM, allowing you to inspect and analyze its structure.
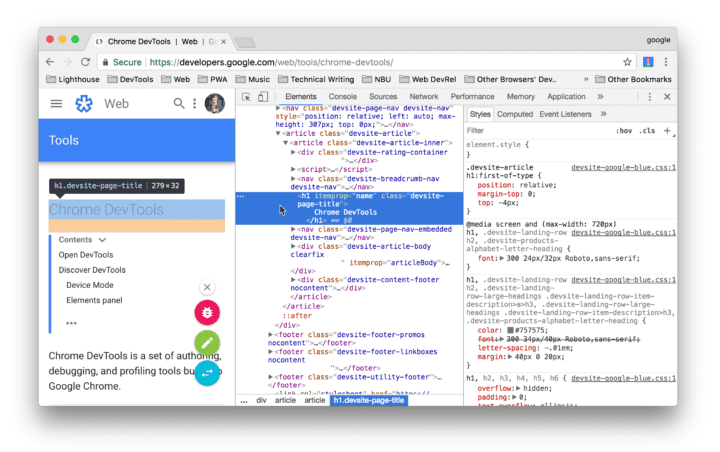
Correlation between HTML and DOM
The DOM is generated based on the HTML code of a web page. Each HTML element corresponds to a node in the DOM tree, and the attributes and content of the HTML element are reflected in the corresponding DOM node. By inspecting the DOM in Devtools, you can compare it with the HTML code to identify any discrepancies or missing elements. This correlation between HTML and DOM is essential for troubleshooting SEO issues related to content visibility or accessibility.
Identifying missing DOM elements
When analyzing the DOM in Devtools, you can quickly identify missing or incorrect elements on your website. This can be particularly helpful when troubleshooting SEO issues related to missing content, broken links, or accessibility. By inspecting the DOM, you can pinpoint the specific elements causing the issue and take appropriate measures to fix them.
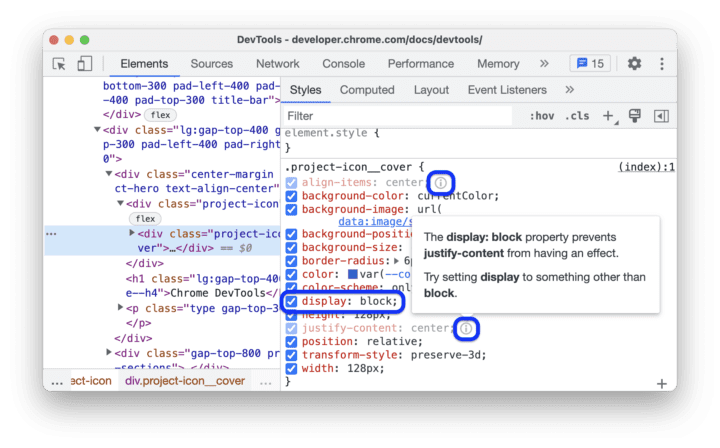
Analyzing rendering issues
The DOM also plays a crucial role in rendering a web page. By inspecting the DOM in Devtools, you can analyze any rendering issues that might be affecting the visual appearance of your website. This is particularly useful when troubleshooting SEO issues related to layout problems, incorrect styling, or elements not displaying as intended. By identifying and resolving rendering issues, you can improve the overall user experience and enhance your website’s SEO.
Examining JavaScript Interaction
Role of JavaScript in web page interaction
JavaScript is a programming language that allows websites to be more dynamic and interactive. Many modern websites heavily rely on JavaScript for various functionalities, such as form validation, content loading, and user interactions. Understanding how JavaScript interacts with your web pages is crucial for troubleshooting SEO issues related to JavaScript-based functionality. Devtools provides extensive tools for examining JavaScript interactions and their impact on your website.
Understanding Googlebot’s interaction limitations
Googlebot is Google’s web crawling bot that discovers and indexes web pages. It interacts with websites differently from regular users, as it doesn’t execute JavaScript or perform complex interactions on web pages. This can be a challenge when troubleshooting SEO issues that involve JavaScript interactions. By understanding Googlebot’s limitations, you can make informed decisions on optimizing your website for better search engine visibility. Devtools can help you analyze how your website behaves without JavaScript and identify any issues that might arise.
Investigating JavaScript-triggered server requests
JavaScript can trigger server requests, such as AJAX requests or API calls, to fetch data or perform specific actions. These server requests play a crucial role in the functionality and performance of your website. By examining the Network tab in Devtools, you can investigate JavaScript-triggered server requests and analyze their timing, responses, and impact on your website’s SEO. This information can help you optimize your server requests, improve performance, and improve user experience.

Navigating the Sources Panel
Understanding the Sources panel
The Sources panel in Devtools allows you to navigate and inspect the source code of your website. It provides a comprehensive view of all the files that make up your web pages, including HTML, CSS, JavaScript, and more. By exploring the Sources panel, you can gain insights into how your website is structured, how different files interact, and how they contribute to its functionality and SEO.
Linking server requests to source code
One of the critical features of the Sources panel is the ability to link server requests to specific lines of code in your source files. When analyzing a network request in the Network tab, you can easily navigate to the corresponding file and inspect the code that triggered the request. This helps you understand the relationship between server requests and the code that drives them, allowing you to identify any issues or optimizations that might be required.
Inspecting JavaScript file execution in real-time
The Sources panel also provides a robust debugging environment for JavaScript files. You can set breakpoints, step through code execution, and inspect variables and objects in real time. This is particularly useful when troubleshooting SEO issues related to JavaScript functionality or performance. By debugging your JavaScript code in Devtools, you can identify and fix any errors, optimize performance, and ensure a smoother user experience.
Integrating Browser Devtools and Google Search Console
Role of Google Search Console in SEO
Google Search Console is a free tool provided by Google that helps website owners monitor, analyze, and optimize their websites for search engine visibility. It offers valuable insights into how your website is performing in Google search results, including indexing information, crawling, and search traffic. By integrating Google Search Console with Devtools, you can leverage both tools’ power to understand your website’s performance and SEO.
Correlation between Googlebot rendering and Browser Devtools
Google Search Console provides a feature called “URL Inspection,” which allows you to see how Googlebot renders and indexes a specific URL from your website. This feature can be used with Devtools to compare the rendering and functionality of your website in Googlebot and the browser. By correlating the results from Googlebot rendering and Devtools analysis, you can identify any discrepancies or issues affecting your website’s visibility in search results.
Using both tools for efficient troubleshooting
By combining the insights and tools from both Google Search Console and Devtools, you can efficiently troubleshoot and resolve SEO issues on your website. Devtools provides detailed technical analysis and debugging capabilities, while Google Search Console offers broader visibility into search engine performance. By leveraging both tools, you can understand your website’s SEO holistically and take appropriate measures to optimize its performance.

Advanced Devtools Features
Exploring advanced features in Devtools
Devtools offers many advanced features that enhance debugging and troubleshooting capabilities. These features include performance profiling, memory analysis, security audits, and more. By exploring these advanced features, you can gain deeper insights into your website’s performance, identify potential security vulnerabilities, and optimize its overall functionality and user experience.
Use cases for advanced features
Advanced Devtools features have various use cases in SEO troubleshooting. For example, performance profiling can help you identify and optimize areas of your website that are causing slow page load times. Memory analysis can help you identify and fix memory leaks or excessive usage. Security audits can help ensure your website is secure and free from common vulnerabilities. By leveraging these advanced features, you can enhance your SEO efforts and create a better user experience.
Advanced Devtools impact on SEO troubleshooting
The advanced features in Devtools provide a more in-depth understanding of your website’s performance and functionality. Using these features, you can identify and resolve complex SEO issues that are not apparent through basic debugging methods. The insights gained from advanced Devtools analysis can help you optimize your website for improved search engine visibility, higher rankings, and better user engagement.
Conclusion
Major takeaway points
Browser Devtools are a valuable set of tools for SEO troubleshooting. By understanding and effectively utilizing Devtools, you can debug various technical issues affecting your website’s search engine visibility. Some major takeaway points from this article include:
- Devtools provide insights into network requests, server response time, DOM structure, JavaScript interaction, and more.
- Analyzing the Network tab helps identify slow server response time and optimize network performance.
- Inspecting the DOM allows you to identify missing or incorrect elements on your website.
- Understanding JavaScript interaction and Googlebot’s limitations helps in troubleshooting JavaScript-related SEO issues.
- Navigating the Sources panel allows you to inspect and debug the source code of your website.
- Integrating Devtools with Google Search Console provides a comprehensive view of your website’s SEO performance.
- Exploring advanced Devtools features can provide deeper insights and optimize your website’s performance.
Summarizing the role of Browser Devtools in SEO troubleshooting
Browser Devtools play a crucial role in SEO troubleshooting by providing comprehensive insights into various technical aspects of your website. From analyzing network requests and server response time to inspecting the DOM and examining JavaScript interaction, Devtools offers many features and functionalities to help you identify and resolve SEO issues. By utilizing Devtools effectively, you can optimize your website’s performance, improve search engine visibility, and enhance user experience.
Suggesting future topics based on interest
Please let us know in the comments if you want to learn more about specific Devtools or SEO troubleshooting aspects. We value your feedback and will consider your suggestions for future articles. Stay tuned for more informative content on SEO and Devtools!